Core Web Vitals: How to Measure Them Without Enough Traffic
In 2026, Core Web Vitals remain one of the main benchmarks for evaluating the technical quality of a website. Google uses them as a ranking signal and displays them in Search Console. The problem is that many business websites, especially in B2B, don’t generate enough traffic to obtain this data.
If you’ve opened the "Page Experience" report in Search Console and found the section empty, you’re not alone. In this article we’ll see why this happens and what concrete solutions you have available.
What Are Core Web Vitals and Why They Matter
Core Web Vitals are three metrics that measure the browsing experience of a real user. In 2026 the active metrics are:
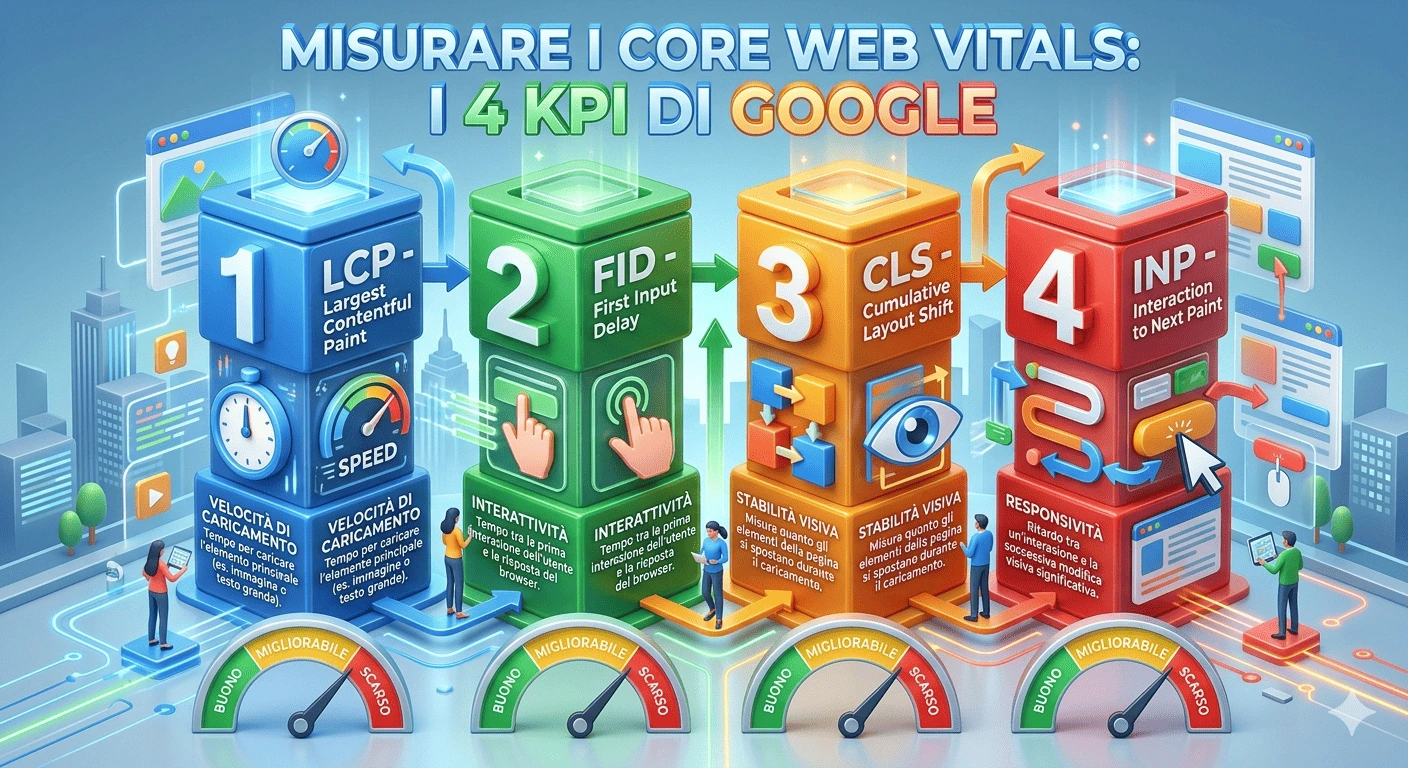
LCP (Largest Contentful Paint) measures the time needed to load the largest visual element on the page. A good value is under 2.5 seconds.
INP (Interaction to Next Paint) measures the responsiveness of the page to user interactions, such as clicks and scrolls. A good value is under 200 milliseconds. INP replaced FID in 2024.
CLS (Cumulative Layout Shift) measures the visual stability of the page. It quantifies unexpected shifts of elements during loading. A good value is under 0.1.
For B2B companies these metrics have a direct impact. A slow or unstable site reduces the trust of a potential customer during the evaluation phase. Those operating in sectors where the sales cycle is long cannot afford a poor-quality first digital contact.
Why Search Console Doesn’t Show Your Data
The Core Web Vitals you see in Search Console come from the Chrome User Experience Report, known as CrUX. This is data collected from real Chrome users who have enabled usage statistics synchronization.
This means that not all visits to your site count. You need visitors who use Chrome and have data sharing enabled. Google aggregates this data over a 28-day window and publishes it monthly.
The result is that a minimum threshold of eligible visits is needed. Google has never declared an official number, but the estimate is a few hundred per month. For many B2B business websites that receive perhaps 200–500 total monthly visits, this threshold is not reached.
The report remains empty and you have no way of knowing whether your site is fast or slow by Google’s standards.
Lab Data vs Field Data: The Difference That Matters
Before looking for solutions it’s useful to understand the difference between two types of measurement.
Lab data is generated by tools that simulate a user visit in a controlled environment. Tools like WebPageTest or GTmetrix run the test from a server, with a predefined connection and a simulated device. The result is repeatable but doesn’t reflect the variety of devices, connections, and conditions of your real users.
Field data is collected directly from users during browsing. Each visit produces a unique measurement, influenced by the device, network, and user behavior. Google uses field data, collected via CrUX, for ranking.
For those with low traffic the ideal solution is to combine both approaches. Lab data gives you an immediate snapshot. Field data, even if scarce, gives you the real picture.
How to Measure Core Web Vitals Without Depending on Google
There are several approaches, each with specific advantages.
Lab Testing Tools
These tools require no traffic. You can test any page at any time.
WebPageTest is the most complete tool. It allows you to choose the server location, connection type, and device. Results include videos, loading waterfalls, and all Web Vitals metrics. It’s free and open source.
GTmetrix offers a simpler interface and clear reports. It shows Web Vitals with practical suggestions for each detected problem.
DebugBear offers continuous monitoring even on the free plan. It tracks metrics over time and alerts you when something deteriorates.
The limitation of lab data is that it doesn’t capture the variability of real-world conditions. A site may appear fast in tests but slow for users browsing on mobile with an unstable connection.
Collecting Field Data Independently
The most effective method for low-traffic sites is to collect field data directly. The web-vitals JavaScript library, developed by the Chrome team and released as open source, allows you to measure LCP, INP, and CLS in every visitor’s browser.
The operation is simple. The script loads along with the page and, at the end of the browsing session, sends the metrics to an endpoint you choose. It can be your own server, a database, or an analytics service.
The advantage over CrUX is that every single visit is recorded. No minimum threshold is needed. With 50 visits per day, in a week you already have 350 real measurements — enough to identify problematic pages and set priorities.
This approach also gives you control over the data. You can segment by page, by device, by time slot. You can calculate the P75, which is the value Google uses for ranking: the value below which 75% of measurements fall.
Browser Extensions for Quick Tests
For a quick check during development, browser extensions like Web Vitals for Chrome show values in real time. They’re not a monitoring tool, but they’re useful for verifying the impact of a change before publication.
P75: The Metric Google Actually Uses
When Google evaluates a site it doesn’t look at the average of measurements. It looks at the 75th percentile, indicated as P75. This means that if your LCP is 2.1 seconds as P75, 75% of visits have an LCP equal to or better than that value.
The choice of P75 has a precise logic. The average hides extreme values. A site might have an average LCP of 2 seconds, but 25% of visits could exceed 4 seconds. With P75 Google ensures that the majority of users have an acceptable experience.
For your internal monitoring it’s important to replicate the same criterion. If you only measure the average you risk having an overly optimistic picture. Always calculate P75 for each metric and for each page.
Which Pages to Monitor First
Not all pages carry the same weight. In a B2B context, monitoring priorities should follow the potential customer’s journey.
The homepage is often the first point of contact. A slow LCP here means a negative first impression before even showing the value proposition.
Campaign landing pages are fundamental. If you invest in advertising and loading time exceeds 3 seconds, a significant portion of traffic abandons before seeing the content.
Product or service pages are the heart of B2B conversion. Visual stability and responsiveness become crucial when the visitor is evaluating your offering.
Blog pages drive organic traffic and build authority. A high CLS on these pages, caused by advertising banners or images without defined dimensions, damages the perception of professionalism.
A Concrete Action Plan
If your site currently has no Core Web Vitals data, here is a practical path.
In the first week, run a lab test on all main pages with WebPageTest. This gives you an initial snapshot. Note the LCP, INP, and CLS values for each page and identify those below the threshold.
In the second week, integrate field data collection into the site. Configure an endpoint to receive the metrics and start accumulating real data.
From the third week onwards, analyze the collected field data. Compare them with lab results. If there are significant differences, focus on field data: it reflects your users’ actual experience.
Every month, review P75 metrics by page. Address pages with poor values. Monitor the impact of optimizations in the following month’s data.
Want to learn more? Contact us: we’re available for a personalized consultation.